'%3e%3cstop%20id='eGiXwqHvSN22-fill-0'%20offset='0%25'%20stop-color='%235c5396'/%3e%3cstop%20id='eGiXwqHvSN22-fill-1'%20offset='100%25'%20stop-color='%231ba1e3'/%3e%3c/linearGradient%3e%3c/defs%3e%3cpath%20d='M22.462,11.035l2.88,7.097c1.204,2.968,3.558,5.322,6.526,6.526l7.097,2.88c1.312.533,1.312,2.391,0,2.923l-7.097,2.88c-2.968,1.204-5.322,3.558-6.526,6.526l-2.88,7.097c-.533,1.312-2.391,1.312-2.923,0l-2.88-7.097c-1.204-2.968-3.558-5.322-6.526-6.526l-7.097-2.88c-1.312-.533-1.312-2.391,0-2.923l7.097-2.88c2.968-1.204,5.322-3.558,6.526-6.526l2.88-7.097c.532-1.312,2.39-1.312,2.923,0ZM39.945,2.701l.842,2.428c.664,1.915,2.169,3.42,4.084,4.084l2.428.842c.896.311.896,1.578,0,1.889l-2.428.842c-1.915.664-3.42,2.169-4.084,4.084l-.842,2.428c-.311.896-1.578.896-1.889,0l-.842-2.428c-.664-1.915-2.169-3.42-4.084-4.084l-2.428-.842c-.896-.311-.896-1.578,0-1.889l2.428-.842c1.915-.664,3.42-2.169,4.084-4.084l.842-2.428c.31-.896,1.578-.896,1.889,0Z'%20fill='url(%23eGiXwqHvSN22-fill)'/%3e%3c/svg%3e)
NtSaaS® for Market and Credit Risk
An integrated risk management solution that captures both market and credit risk
Financial risks rarely occur in isolation. Realistically, they interact with each other and sometimes amplify risk through complex interdependencies. Traditional siloed risk management approaches often fail to capture these correlations, which can lead to underestimating overall risk exposure and hinder optimal capital allocation.
NtSaaS® for Market and Credit Risk offers an innovative approach that integrates market risk and credit risk, enabling the visualization and quantification of each risk and their interdependencies to achieve more advanced and comprehensive risk management.
Equipped with three industry-standard methods — Variance-Covariance (Delta-Normal), Historical Simulation, and Monte Carlo Simulation — it flexibly meets diverse risk assessment needs.
In addition to calculating key risk metrics such as Value at Risk (VaR) and Expected Shortfall (ES), it supports Marginal VaR/ES (MVaR/MES) to assess the impact of individual risk factors, and Component VaR analysis to decompose risk contributions by type, such as currency, interest rate, and equity. This enables a multifaceted understanding of the portfolio’s risk structure.
Furthermore, it features a high-performance engine capable of running up to one million Monte Carlo simulations at high speed, enabling accurate and rapid risk calculations even for large-scale portfolios containing millions of individual transactions.
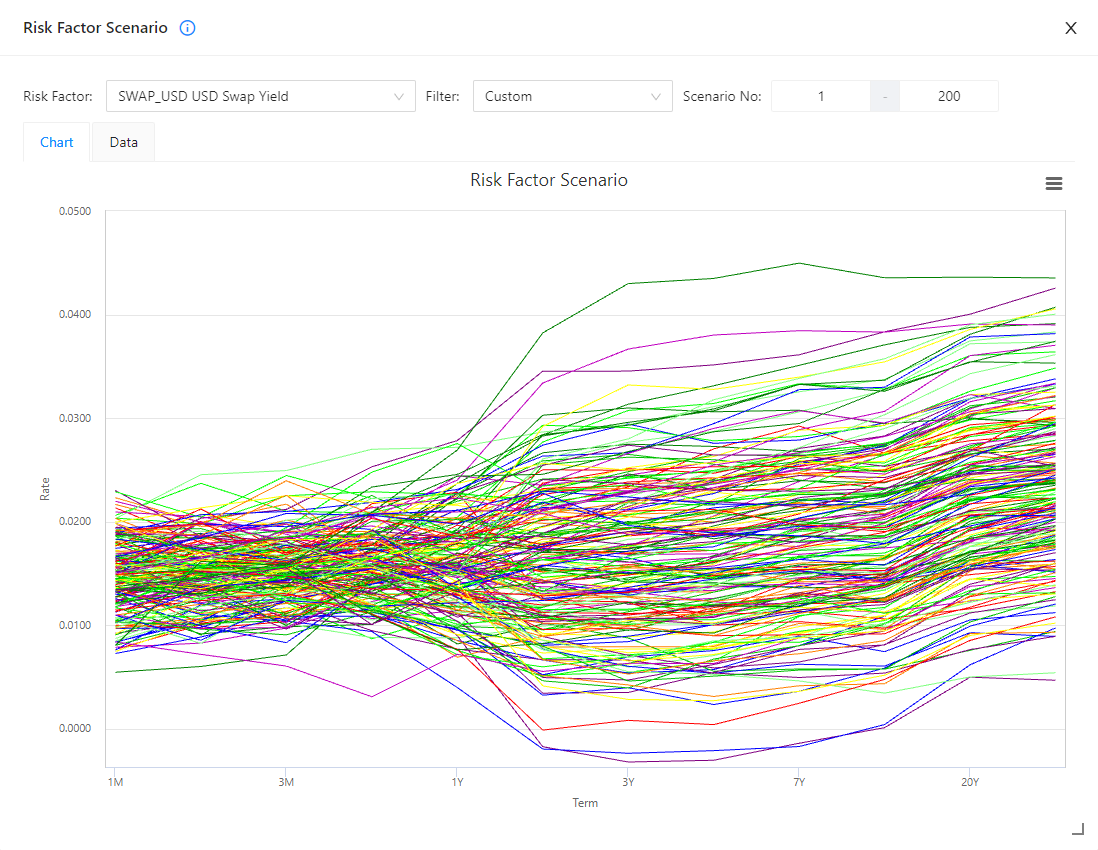
Enables advanced simulation of the impact on credit portfolios under stressed market conditions. Based on assumed scenarios, it incorporates complex factors such as changes in Probability of Default (PD), yield curve inversion, and increased correlations between risk factors for realistic scenario analysis.
This allows for the design of comprehensive stress scenarios that do not depend on a single risk factor, enabling more accurate assessments of potential impacts when risks materialize.
To accurately capture fat tails present in market data, it employs probability distribution models that reflect real-world data characteristics, such as the Johnson SU distribution and Pareto–Gaussian mixture distribution.
This enables risk assessments that more realistically reflect large market movements and stress scenarios — often underestimated under the normal distribution assumption — significantly improving the reliability and precision of risk management.
Includes tools for calculating indicators such as Risk-Adjusted Return on Capital (RAROC) and Risk-Adjusted Return on Assets (RAROA), enabling the evaluation of profitability relative to risk.
Analysis can be performed not only for the overall portfolio, but also by business division, product category, and even down to the individual transaction level, supporting the visualization and optimization of the credit portfolio’s risk-return profile.
This contributes to more accurate management decisions on how and where to allocate limited capital.
By leveraging a dynamic analysis engine (OLAP), it enables real-time insight into the overall portfolio risk structure. Analysis can be drilled down not only by risk type (market risk, credit risk), but also by specific factors such as foreign exchange and interest rates, as well as by business division and other dimensions.
These flexible analysis capabilities make it possible to instantly identify where risks are concentrated, where diversification is effective, and thus support prompt and precise risk response and decision-making.
Modular plans that cover diverse business needs
%20--%3e%3cdefs%3e%3cstyle%3e%20.st0%20{%20fill:%20%23cc6490;%20}%20.st1%20{%20fill:%20%23b50a3f;%20}%20.st2%20{%20fill:%20%23575757;%20}%20.st3%20{%20fill:%20%23d62653;%20}%20.st4%20{%20fill:%20%236e0025;%20}%20%3c/style%3e%3c/defs%3e%3cpath%20class='st2'%20d='M21.4,23.2L2.4,42.1c-2.09,2.09-2.89,5.15-2.1,8l6.9,25.9c.58,2.19,2.83,3.49,5.02,2.9.71-.19,1.36-.57,1.88-1.1l19-18.9c2.09-2.09,2.89-5.15,2.1-8l-6.9-25.9c-.58-2.19-2.83-3.49-5.02-2.9-.71.19-1.36.57-1.88,1.1Z'/%3e%3cpath%20class='st3'%20d='M35.7,60.6l-18.9,18.9c-1.62,1.58-1.66,4.17-.08,5.8.52.53,1.17.91,1.88,1.1l25.9,7c2.87.73,5.91-.11,8-2.2l18.9-18.9c1.62-1.58,1.66-4.17.08-5.8-.52-.53-1.17-.91-1.88-1.1l-25.8-7c-2.9-.76-5.99.07-8.1,2.2Z'/%3e%3cpath%20class='st4'%20d='M93.5,43.9l-7.8-29.3c-.89-3.2-3.4-5.71-6.6-6.6L49.8.2l-1.2-.2c-2.54-.05-4.64,1.97-4.69,4.51,0,.47.05.94.19,1.39l7.8,29.3c.91,3.23,3.46,5.74,6.7,6.6l29.2,7.9h1.2c2.54.03,4.63-2,4.66-4.54,0-.43-.05-.85-.16-1.26Z'/%3e%3cpath%20class='st0'%20d='M51.2,50.6c-3.97-1.03-7.07-4.13-8.1-8.1l-7.8-28.9h-.4c-2.6.02-4.68,2.15-4.66,4.74,0,.39.06.78.16,1.16l7.9,29.3c.89,3.2,3.4,5.71,6.6,6.6l29.3,7.9h1.2c2.6,0,4.7-2.09,4.71-4.69v-.31l-28.9-7.7h0Z'/%3e%3cpath%20class='st1'%20d='M58,43.8c-3.94-1.09-7.01-4.16-8.1-8.1l-7.8-28.9h-.3c-2.65.04-4.77,2.22-4.73,4.87,0,.35.05.69.13,1.03l7.9,29.3c.89,3.2,3.4,5.71,6.6,6.6l29.3,7.9h1.2c2.6,0,4.7-2.09,4.71-4.69v-.31l-28.9-7.7h0Z'/%3e%3c/svg%3e)
Credit Risk
Professional
%20--%3e%3cdefs%3e%3cstyle%3e%20.st0%20{%20fill:%20%236e4900;%20}%20.st1%20{%20fill:%20%23575757;%20}%20.st2%20{%20fill:%20%23c08300;%20}%20.st3%20{%20fill:%20%23eda543;%20}%20.st4%20{%20fill:%20%23ffc00d;%20}%20%3c/style%3e%3c/defs%3e%3cpath%20class='st1'%20d='M21.4,23.2L2.4,42.1c-2.09,2.09-2.89,5.15-2.1,8l6.9,25.9c.58,2.19,2.83,3.49,5.02,2.9.71-.19,1.36-.57,1.88-1.1l19-18.9c2.09-2.09,2.89-5.15,2.1-8l-6.9-25.9c-.58-2.19-2.83-3.49-5.02-2.9-.71.19-1.36.57-1.88,1.1Z'/%3e%3cpath%20class='st4'%20d='M35.7,60.6l-18.9,18.9c-1.62,1.58-1.66,4.17-.08,5.8.52.53,1.17.91,1.88,1.1l25.9,7c2.87.73,5.91-.11,8-2.2l18.9-18.9c1.62-1.58,1.66-4.17.08-5.8-.52-.53-1.17-.91-1.88-1.1l-25.8-7c-2.9-.76-5.99.07-8.1,2.2Z'/%3e%3cpath%20class='st0'%20d='M93.5,43.9l-7.8-29.3c-.89-3.2-3.4-5.71-6.6-6.6L49.8.2l-1.2-.2c-2.54-.05-4.64,1.97-4.69,4.51,0,.47.05.94.19,1.39l7.8,29.3c.91,3.23,3.46,5.74,6.7,6.6l29.2,7.9h1.2c2.54.03,4.63-2,4.66-4.54,0-.43-.05-.85-.16-1.26Z'/%3e%3cpath%20class='st3'%20d='M51.2,50.6c-3.97-1.03-7.07-4.13-8.1-8.1l-7.8-28.9h-.4c-2.6.02-4.68,2.15-4.66,4.74,0,.39.06.78.16,1.16l7.9,29.3c.89,3.2,3.4,5.71,6.6,6.6l29.3,7.9h1.2c2.6,0,4.7-2.09,4.71-4.69v-.31l-28.9-7.7h0Z'/%3e%3cpath%20class='st2'%20d='M58,43.8c-3.94-1.09-7.01-4.16-8.1-8.1l-7.8-28.9h-.3c-2.65.04-4.77,2.22-4.73,4.87,0,.35.05.69.13,1.03l7.9,29.3c.89,3.2,3.4,5.71,6.6,6.6l29.3,7.9h1.2c2.6,0,4.7-2.09,4.71-4.69v-.31l-28.9-7.7h0Z'/%3e%3c/svg%3e)
Market Risk
Professional Lite
Market Risk
Professional
%20--%3e%3cdefs%3e%3cstyle%3e%20.st0%20{%20fill:%20%23575757;%20}%20.st1%20{%20fill:%20%238fa7c9;%20}%20.st2%20{%20fill:%20%233d5481;%20}%20.st3%20{%20fill:%20%234e6db0;%20}%20.st4%20{%20fill:%20%23003ffc;%20}%20%3c/style%3e%3c/defs%3e%3cpath%20class='st0'%20d='M21.4,23.2L2.4,42.1c-2.09,2.09-2.89,5.15-2.1,8l6.9,25.9c.58,2.19,2.83,3.49,5.02,2.9.71-.19,1.36-.57,1.88-1.1l19-18.9c2.09-2.09,2.89-5.15,2.1-8l-6.9-25.9c-.58-2.19-2.83-3.49-5.02-2.9-.71.19-1.36.57-1.88,1.1Z'/%3e%3cpath%20class='st4'%20d='M35.7,60.6l-18.9,18.9c-1.62,1.58-1.66,4.17-.08,5.8.52.53,1.17.91,1.88,1.1l25.9,7c2.87.73,5.91-.11,8-2.2l18.9-18.9c1.62-1.58,1.66-4.17.08-5.8-.52-.53-1.17-.91-1.88-1.1l-25.8-7c-2.9-.76-5.99.07-8.1,2.2Z'/%3e%3cpath%20class='st2'%20d='M93.5,43.9l-7.8-29.3c-.89-3.2-3.4-5.71-6.6-6.6L49.8.2l-1.2-.2c-2.54-.05-4.64,1.97-4.69,4.51,0,.47.05.94.19,1.39l7.8,29.3c.91,3.23,3.46,5.74,6.7,6.6l29.2,7.9h1.2c2.54.03,4.63-2,4.66-4.54,0-.43-.05-.85-.16-1.26Z'/%3e%3cpath%20class='st1'%20d='M51.2,50.6c-3.97-1.03-7.07-4.13-8.1-8.1l-7.8-28.9h-.4c-2.6.02-4.68,2.15-4.66,4.74,0,.39.06.78.16,1.16l7.9,29.3c.89,3.2,3.4,5.71,6.6,6.6l29.3,7.9h1.2c2.6,0,4.7-2.09,4.71-4.69v-.31l-28.9-7.7h0Z'/%3e%3cpath%20class='st3'%20d='M58,43.8c-3.94-1.09-7.01-4.16-8.1-8.1l-7.8-28.9h-.3c-2.65.04-4.77,2.22-4.73,4.87,0,.35.05.69.13,1.03l7.9,29.3c.89,3.2,3.4,5.71,6.6,6.6l29.3,7.9h1.2c2.6,0,4.7-2.09,4.71-4.69v-.31l-28.9-7.7h0Z'/%3e%3c/svg%3e)
Market and Credit Risk
Enterprise
Feature Comparison
| Credit Risk | Market Risk | Market and Credit Risk | ||||
|---|---|---|---|---|---|---|
| Professional | Professional Lite | Professional | Enterprise | |||
| Methodology | Monte Carlo Simulation | Market + Credit Risk | ||||
| Credit Risk | ||||||
| Market Risk | ||||||
| Historical Simulation | Market Risk | |||||
| Cumulative Historical Simulation | Market Risk (Profit/Loss calculations are always based on the value of the instrument at t=0) | |||||
| Variance-Covariance VaR | ||||||
| Merton Structural Model (Merton [1974]) | ||||||
| Random number generator | Mersenne Twister, Numerical Recipes ran2 | |||||
| Convergence Improvement | Quadratic resampling, Probability matching | |||||
| Yield Curve Scenario | Principal Component Analysis Monte Carlo Simulation | |||||
| Extrapolation using the Smith-Wilson method | ||||||
| Portfolio Analysis and Evaluation | VaR Indicators | EL, UL, VaR, Marginal VaR, Conditional VaR | ||||
| Risk Contribution | ||||||
| Sensitivity Analysis | Duration, BPV, Modified Convexity | |||||
| Option Greeks | Delta, Gamma, Vega, Rho | |||||
| Aggregated display | Transaction based or Obligor based | |||||
| Accounting method | Historical Cost or Mark-to-Market at individual transaction level | |||||
| Fair Value calculation methods | ||||||
| Prepayment | Fixed deposit, Mortgage loan etc. | |||||
| Supported Financial Instruments | Interest related products | Loan, Bond | ||||
| Loan, Deposit, Bond, Swap etc. | ||||||
| Spot products | Stock | |||||
| Spot & Forward products | Stock, Fund, FX etc. | |||||
| Option products | Stock, Index, FX, Swap, Bond | |||||
| Results Display | OLAP (Online Analytical Processing) | Allows analysis by segments according to Obligor or Transaction attributes | ||||
| Aggregated transaction information | VaR, ES, Book value, Market value, Profit/Loss etc. | |||||
| Detailed transaction information | Cash Flow Table, Evaluation Scenario and Exposure etc. | |||||
| Ladder report | Maturity Ladder, Cash Flow Ladder, Exposure, GPS etc. | |||||