'%3e%3cstop%20id='eGiXwqHvSN22-fill-0'%20offset='0%25'%20stop-color='%235c5396'/%3e%3cstop%20id='eGiXwqHvSN22-fill-1'%20offset='100%25'%20stop-color='%231ba1e3'/%3e%3c/linearGradient%3e%3c/defs%3e%3cpath%20d='M22.462,11.035l2.88,7.097c1.204,2.968,3.558,5.322,6.526,6.526l7.097,2.88c1.312.533,1.312,2.391,0,2.923l-7.097,2.88c-2.968,1.204-5.322,3.558-6.526,6.526l-2.88,7.097c-.533,1.312-2.391,1.312-2.923,0l-2.88-7.097c-1.204-2.968-3.558-5.322-6.526-6.526l-7.097-2.88c-1.312-.533-1.312-2.391,0-2.923l7.097-2.88c2.968-1.204,5.322-3.558,6.526-6.526l2.88-7.097c.532-1.312,2.39-1.312,2.923,0ZM39.945,2.701l.842,2.428c.664,1.915,2.169,3.42,4.084,4.084l2.428.842c.896.311.896,1.578,0,1.889l-2.428.842c-1.915.664-3.42,2.169-4.084,4.084l-.842,2.428c-.311.896-1.578.896-1.889,0l-.842-2.428c-.664-1.915-2.169-3.42-4.084-4.084l-2.428-.842c-.896-.311-.896-1.578,0-1.889l2.428-.842c1.915-.664,3.42-2.169,4.084-4.084l.842-2.428c.31-.896,1.578-.896,1.889,0Z'%20fill='url(%23eGiXwqHvSN22-fill)'/%3e%3c/svg%3e)
NtSaaS® for ALM
A strategic ALM solution for adapting to a changing financial environment
For financial institutions, effective Asset Liability Management (ALM) is essential for optimizing the balance sheet, mitigating mismatch risks, responding to fluctuations in interest rates and liquidity, and securing stable earnings.
Especially in today’s increasingly uncertain economic environment, a forward-looking and integrated ALM approach holds the key to sustainable management.
NtSaaS® for ALM is an integrated, high-performance ALM solution developed to address these complex challenges. Equipped with the flexibility and scalability to support strategic decision-making, it powerfully enables next-generation asset liability management.
Manage liquidity risk, interest-rate risk, and earnings-at-risk within a single, unified framework. NtSaaS® for ALM integrates credit risk directly into balance sheet simulations, providing a truly holistic perspective on performance and exposure.
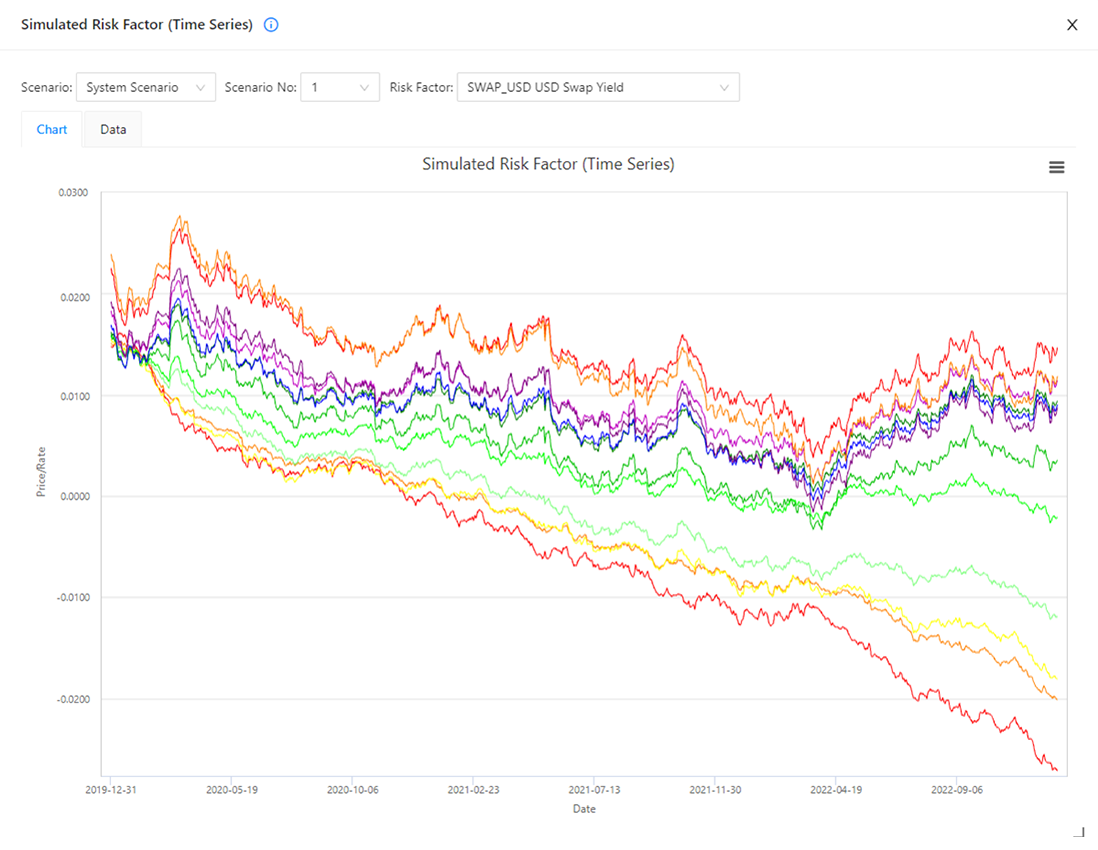
Generate detailed financial scenarios by performing multi-step simulations of path-dependent events at a daily resolution, covering time horizons that can range from days to years.
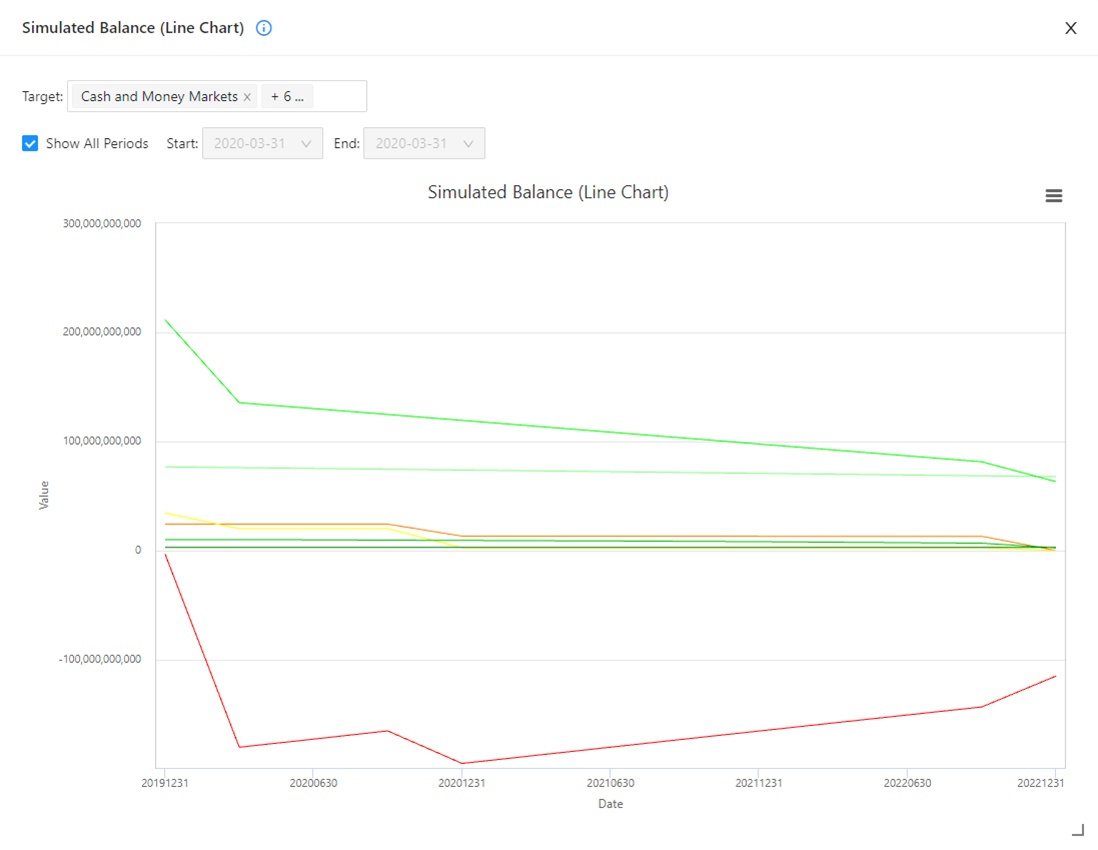
Simulate general ledger account balances along the time axis to examine short-term interest rate impacts and longer-term effects of mortgage loan prepayments, credit loss, funding operations, taxation, dividends, and future portfolio rebalancing.
Conduct forward-looking stress tests by applying simultaneous shocks to market risk factors, credit ratings, LGDs, and correlations.
Supports multiple accounting methods, including amortization/accumulation and book/market value. For insurers, it offers mark-to-market valuation of specialized insurance instruments, considering factors like prepayment and mortality rates, and allows the input of external liability cash flows from actuarial systems.
The service performs both Net Economic Value (NEV) and Net Income (NI) simulations. For banks, it directly supports Interest Rate Risk in the Banking Book (IRRBB) analysis, including the calculation of required metrics such as change in Economic Value of Equity (ΔEVE) and change in Net Interest Income (ΔNII).
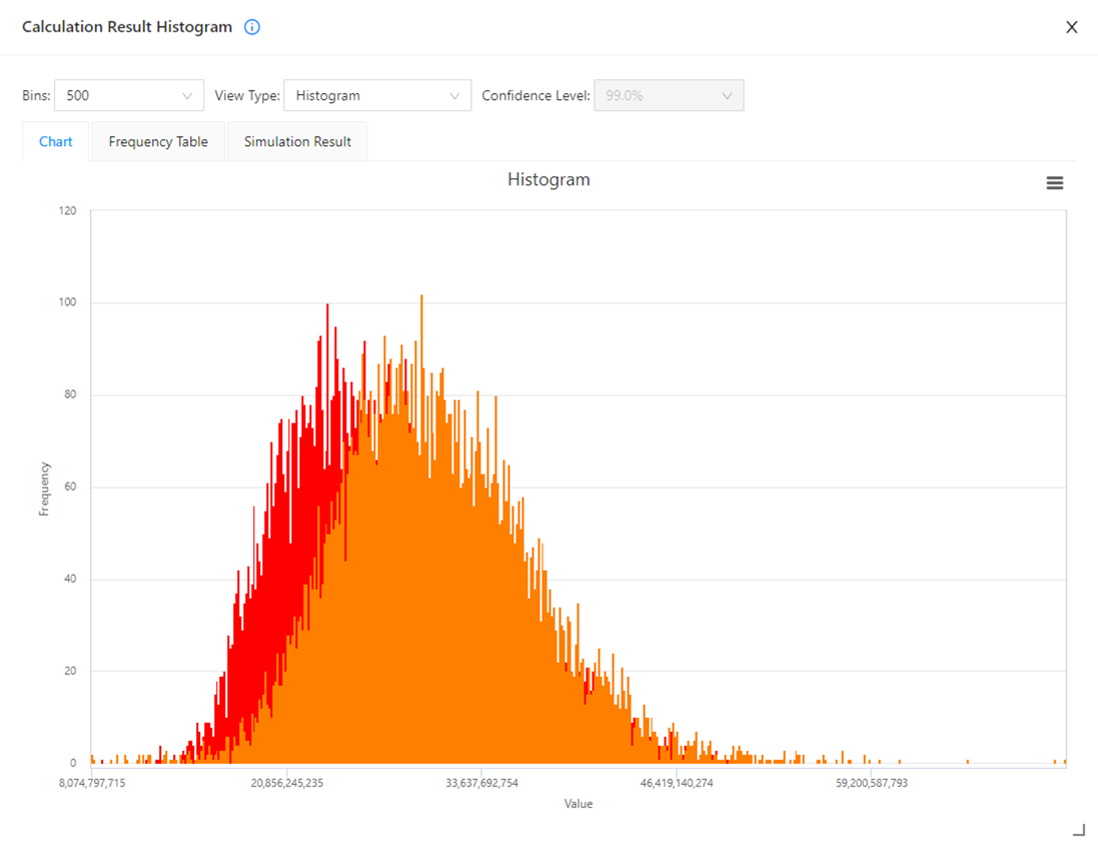
Utilizes a robust Monte Carlo simulator capable of up to one million iterations and performs realistic fat-tail analysis using Johnson SU and Pareto-Gaussian distributions.
Generates traditional ALM reports, such as maturity, cash flow, and BPV/GPS ladders, alongside insightful analytical reports like Income Gain and Income Yield Rate.
Includes Fund Transfer Pricing (FTP) capabilities. A dynamic Online Analytical Processing (OLAP) engine provides a bird's-eye view of the entire portfolio, with the ability to drill down to individual transactions and cash flows. These multi-dimensional analyses are performed on-the-fly for immediate insight.
Supports dynamic investment strategies and allows for the simulation of future portfolio rebalancing based on predefined market conditions or strategic plans.
For banks, a Business Planning feature supports dynamic portfolio simulation for more comprehensive analysis.
For insurance companies, it supports the establishment of strategic asset allocation strategies.
Modular plans that cover diverse business needs
%20--%3e%3cdefs%3e%3cstyle%3e%20.st0%20{%20fill:%20%23575757;%20}%20.st1%20{%20fill:%20%23359d23;%20}%20.st2%20{%20fill:%20%2386bd73;%20}%20.st3%20{%20fill:%20%2300dd5b;%20}%20.st4%20{%20fill:%20%231a610c;%20}%20%3c/style%3e%3c/defs%3e%3cpath%20class='st0'%20d='M21.4,23.2L2.4,42.1c-2.09,2.09-2.89,5.15-2.1,8l6.9,25.9c.58,2.19,2.83,3.49,5.02,2.9.71-.19,1.36-.57,1.88-1.1l19-18.9c2.09-2.09,2.89-5.15,2.1-8l-6.9-25.9c-.58-2.19-2.83-3.49-5.02-2.9-.71.19-1.36.57-1.88,1.1Z'/%3e%3cpath%20class='st3'%20d='M35.7,60.6l-18.9,18.9c-1.62,1.58-1.66,4.17-.08,5.8.52.53,1.17.91,1.88,1.1l25.9,7c2.87.73,5.91-.11,8-2.2l18.9-18.9c1.62-1.58,1.66-4.17.08-5.8-.52-.53-1.17-.91-1.88-1.1l-25.8-7c-2.9-.76-5.99.07-8.1,2.2Z'/%3e%3cpath%20class='st4'%20d='M93.5,43.9l-7.8-29.3c-.89-3.2-3.4-5.71-6.6-6.6L49.8.2l-1.2-.2c-2.54-.05-4.64,1.97-4.69,4.51,0,.47.05.94.19,1.39l7.8,29.3c.91,3.23,3.46,5.74,6.7,6.6l29.2,7.9h1.2c2.54.03,4.63-2,4.66-4.54,0-.43-.05-.85-.16-1.26Z'/%3e%3cpath%20class='st2'%20d='M51.2,50.6c-3.97-1.03-7.07-4.13-8.1-8.1l-7.8-28.9h-.4c-2.6.02-4.68,2.15-4.66,4.74,0,.39.06.78.16,1.16l7.9,29.3c.89,3.2,3.4,5.71,6.6,6.6l29.3,7.9h1.2c2.6,0,4.7-2.09,4.71-4.69v-.31l-28.9-7.7h0Z'/%3e%3cpath%20class='st1'%20d='M58,43.8c-3.94-1.09-7.01-4.16-8.1-8.1l-7.8-28.9h-.3c-2.65.04-4.77,2.22-4.73,4.87,0,.35.05.69.13,1.03l7.9,29.3c.89,3.2,3.4,5.71,6.6,6.6l29.3,7.9h1.2c2.6,0,4.7-2.09,4.71-4.69v-.31l-28.9-7.7h0Z'/%3e%3c/svg%3e)
ALM
Professional
ALM
Enterprise
Feature Comparison
| ALM | ||||
|---|---|---|---|---|
| Professional | Enterprise | |||
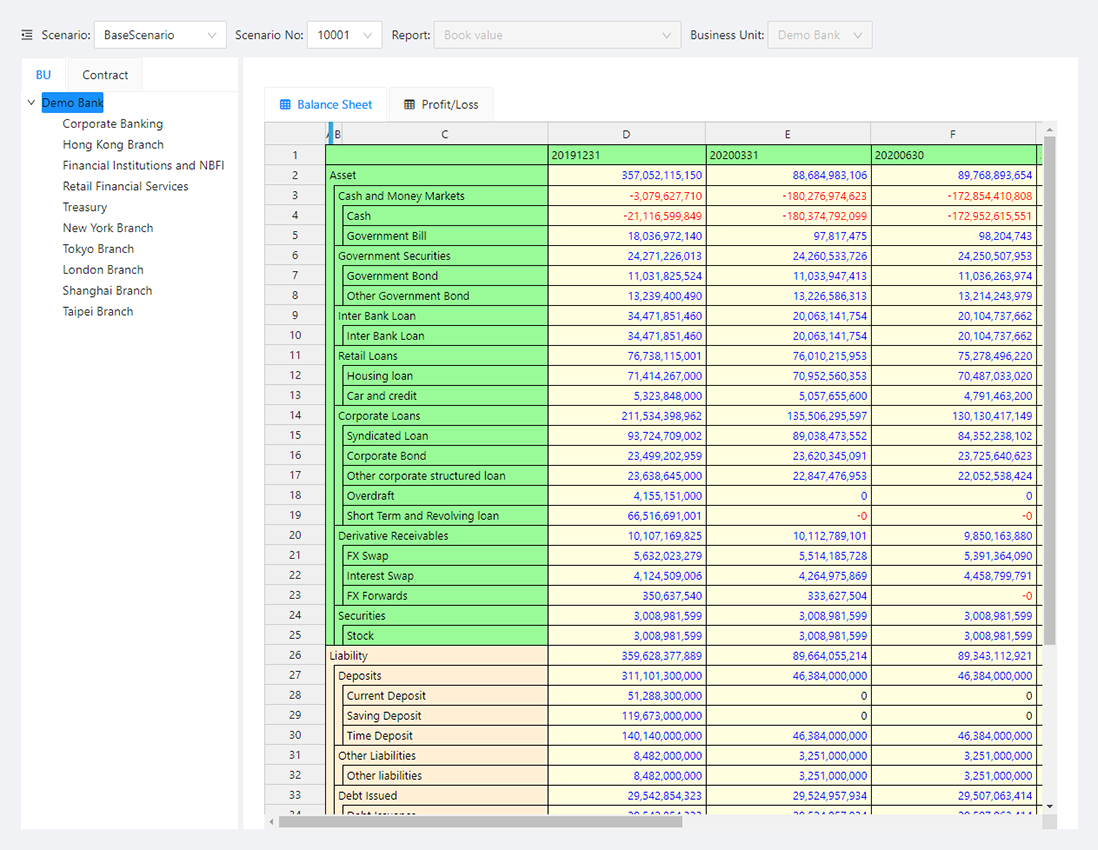
| Accounting reports and methodology | Balance Sheet (BS), Profit/Loss Statement (P&L), Financial Indicators | |||
| Multiple future evaluation dates | Specify any number of future dates | |||
| Accounting method | Historical cost, Mark-to-market, Impairment | |||
| Fund Transfer Pricing | Supports up to 5 Fund Transfer Pricing for business units | |||
| Financial Closing | Supports the accumulation of net profit/loss and tax payable | |||
| Financial Indicators | Financial Indicator can be customized by formulas | |||
| Scenario Type | Market Scenario | |||
| Base Scenario | Scenario where the economic environment does not change from base date | |||
| Forward Scenario | Scenario where the interest rates are based on the forward rates as of base date | |||
| User-defined Scenarios | Supports scenario analysis and stress testing | |||
| Composite Yield | Composite yields are the yield indices calculated from market yield | |||
| Credit Scenario | Based on Merton Structural Model (Merton [1974]) | |||
| Integrated Scenario (Market + Credit) | ||||
| Portfolio Analysis & Evaluation | Balance Report | Book Value, Fair Value Balance | ||
| Profit and Loss Report | Income Gain, Capital Gain | |||
| Ladder Report | Maturity Ladder, Cash Flow Ladder | |||
| Risk Indicator Report | BPV, EXPOSURE | |||
| Spread Adjustment | Spread will be internally calculated for the adjustment of initial market value | |||
| Fair Value calculation | Fair value calculation method can be specified at individual transaction level | |||
| Supported Financial Instruments | Interest related product | Loan, Deposit, Bond, Swap etc. | ||
| Spot and Forward products | Stock, Fund, FX etc. | |||
| Results Display | Financial Statements at future evaluation dates | Future Balance Sheet (BS), Profit/Loss Statement (P&L), Financial Indicators | ||
| OLAP (Online Analytical Processing) | Allows analysis by segments according to Transaction attributes | |||
| Balance Report | Book Value, Fair Value Balance | |||
| Ladder Report | Maturity Ladder, Cash Flow Ladder | |||
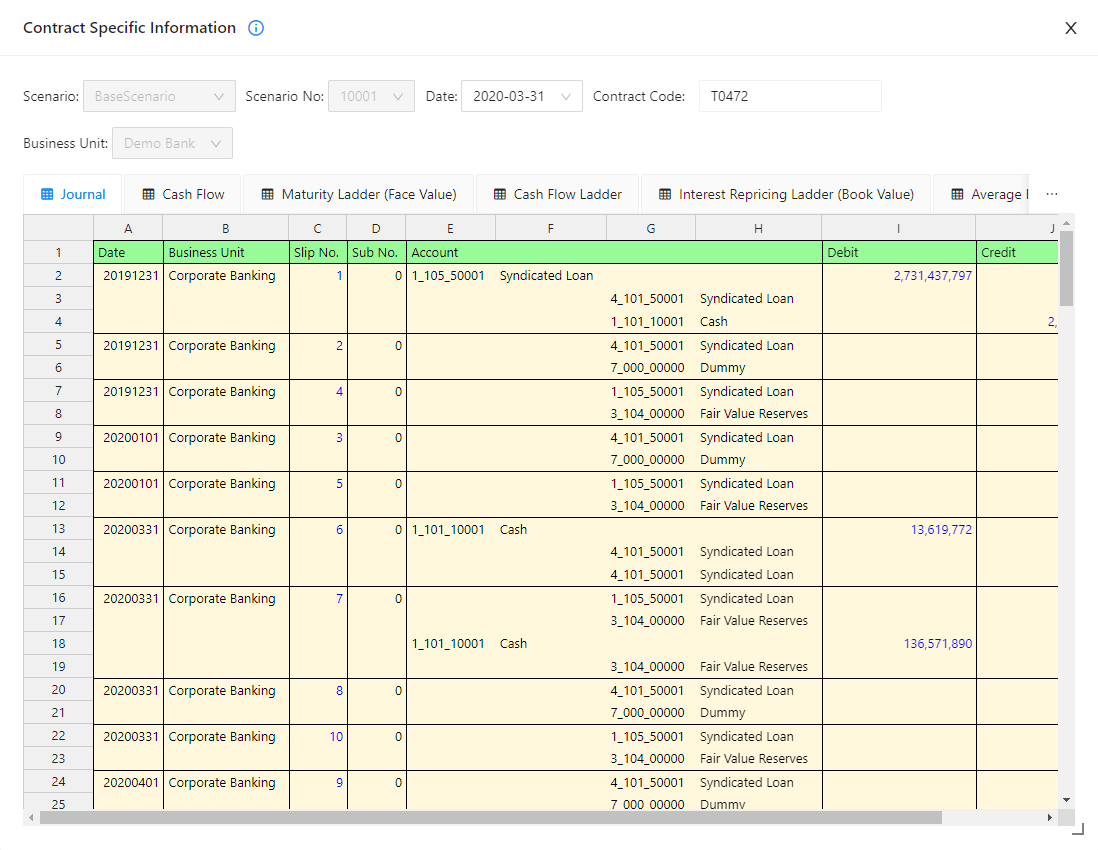
| Detailed transaction information | Journal, Cash Flow Table etc. | |||